Greater Vancouver Area
Aug 2024 update
8/27/20242 min read


The Greater Vancouver housing market in July 2024 presented a complex picture with varied trends across different property types and metrics. While some figures showed annual growth, the month-over-month data revealed declines, painting a nuanced picture for potential buyers and sellers.
Average Home Prices
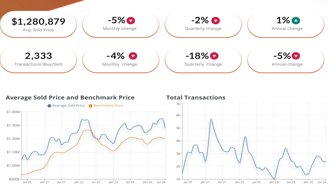
In July 2024, the average home price in Greater Vancouver was $1,280,878. This marks a modest 1% increase compared to the same period last year but a significant 5.1% decline from June 2024. Breaking it down by property type:
- Detached Houses: The average sale price was $2,122,666, down 9.4% from June 2024 and 1.7% year-over-year.
- Attached Homes: The average price stood at $1,235,789, experiencing a 2.8% monthly decline and a 0.8% decrease from last year.
- Apartments: Averaging $818,315, apartment prices saw a minimal month-over-month drop of 0.2% and a 0.5% annual decline.
Benchmark Prices
The benchmark home price in Metro Vancouver was $1,197,700 in July 2024, reflecting a 0.8% decrease both monthly and annually. Here's a closer look at the benchmark prices by property type:
- Detached Homes: The benchmark price decreased by 0.6% from the previous month to $2,049,000, despite a 2.1% increase over the past year.
- Attached Homes: With a benchmark price of $1,124,700, attached homes saw a 1.2% monthly decline but a 1.4% year-over-year increase.
- Apartments: The benchmark price for apartments was $768,200, down 0.7% from June 2024 and 0.3% from July 2023.
Sales and Listings
In July 2024, a total of 2,333 homes were sold in Vancouver. This included:
- Detached Homes: 688 units sold
- Apartments: 1,192 units sold
- Attached Homes: 437 units sold
Metro Vancouver ended July with 14,326 active listings, a 39% increase from last year and a 1% rise from the previous month, marking a multi-year high. New listings rose by 20% year-over-year to 5,597, although this represented a 2.2% decrease from the previous month.
Market Dynamics
Home sales fell by 5% year-over-year, leading to a sales-to-active listings ratio of 16%, consistent with June but lower than the 20% observed in May. The sales-to-new-listings ratio (SNLR) for July was 42%, aligning with June's figure but slightly down from 43% in May.
In market terms, an SNLR above 60% signals a seller's market, while below 40% indicates a buyer's market. A ratio between 40% and 60% is considered balanced. With the current SNLR at 42%, the Greater Vancouver market is leaning towards balanced conditions but edging closer to a buyer's market.
Implications for Buyers and Sellers
These mixed trends suggest a market in flux, with opportunities and challenges for both buyers and sellers. Buyers may find more negotiating power with increased listings and declining prices, while sellers need to be strategic in pricing and marketing their properties to stand out in a crowded market.
As the Greater Vancouver housing market continues to evolve, staying informed and adaptable will be key. Keep an eye on upcoming trends and data to make well-informed decisions in this dynamic market. Stay tuned for more updates and insights.