Great Vancouver Area
Mar 2025 Update
GVA
3/26/20251 min read


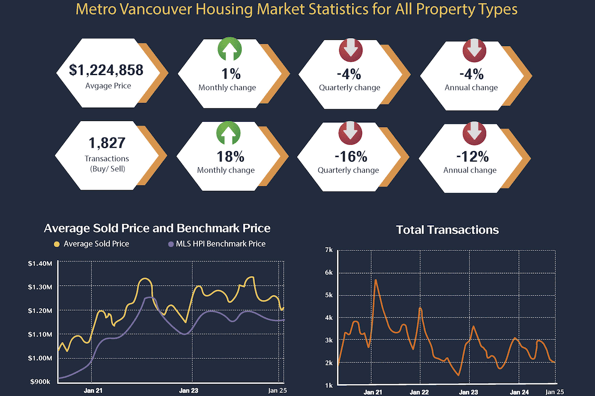
Greater Vancouver Housing Market: February 2025 Snapshot
The region’s housing market showcased diverging trends across property types, with detached homes demonstrating resilience while apartments faced sustained pressure.
Average Prices: A Split Performance
Overall Average Home Price: $1,224,858 (-4.0% year-over-year)
Detached Homes: $2,125,119 (+1.4% month-over-month, -1.7% year-over-year)
Attached Homes: $1,231,922 (+0.6% month-over-month, -2.6% year-over-year)
Apartments: $784,785 (-2.7% month-over-month, -5.1% year-over-year)
Benchmark Prices: Stability Meets Volatility
Metro Vancouver Composite Benchmark: $1,169,100 (-1.1% year-over-year, -0.3% month-over-month)
Detached Homes: $2,006,100 (+1.8% year-over-year, +0.1% month-over-month)
Attached Homes: $1,087,100 (-1.2% year-over-year, -1.7% month-over-month)
Apartments: $747,500 (-2.8% year-over-year, -0.1% month-over-month)
Key Insights
Detached Home Demand Endures: Despite broader price softening, detached homes saw annual benchmark price growth (+1.8%) and modest monthly gains, signaling sustained buyer interest in larger properties.
Apartment Market Struggles: Apartments faced dual declines in both average and benchmark prices, reflecting oversupply concerns or shifting preferences toward more spacious housing.
Short-Term Stabilization: While monthly average prices for attached homes edged upward (+0.6%), longer-term declines (-2.6% annually) highlight ongoing affordability adjustments.
Benchmark vs. Average Discrepancy: The steeper annual drop in average prices (-4.0%) compared to the composite benchmark (-1.1%) suggests higher-value properties may be transacting less frequently, skewing averages downward.